
Heat data sounds straightforward. But when you start working with it, you realise just how complicated and messy it can be – and how much accurate data matters when you're trying to understand where people are most at risk during extreme heat eventsPeriods of very hot weather that can harm health and wellbeing..
As a research officer studying climate model simulations in cities, I have to use accurate data if I want to draw the right conclusions about heat. But this is not a simple process, and it is this topic that has become the focus of my work for the HE²AT project.
The Problem with Heat Data
The idea behind my research project for the HE²AT Center is that we don't have a lot of heat information, or that this information is complicated. Often different datasets have to be used to get accurate heat information, including data from satellites, weather station data, and reanalysis datasets – which combine historical weather observations with climate models to produce a consistent estimate of past climate conditions.
But satellite data doesn't reflect real-world heat, and other datasets have gaps or don't have enough spatial resolution – meaning they can't show temperature differences across small areas. So how do we get to more useable heat information?
Our models for climate change and forecasting can help in this regard. As computer programs that researchers use to simulate weather patterns over time, these models can recreate what a specific region's climate looks like.
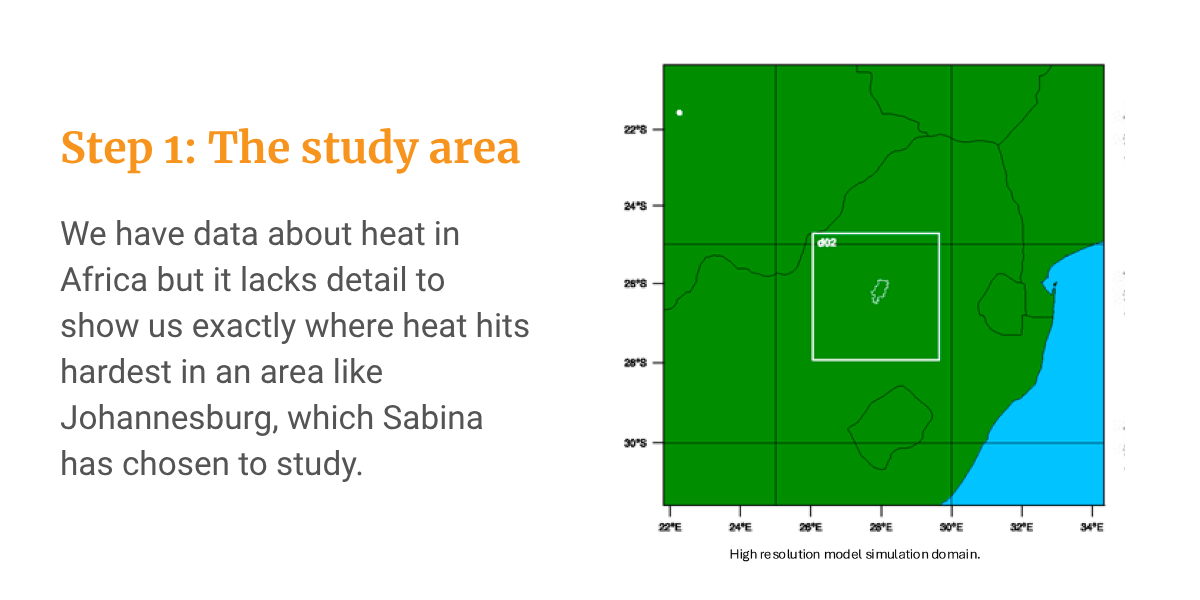
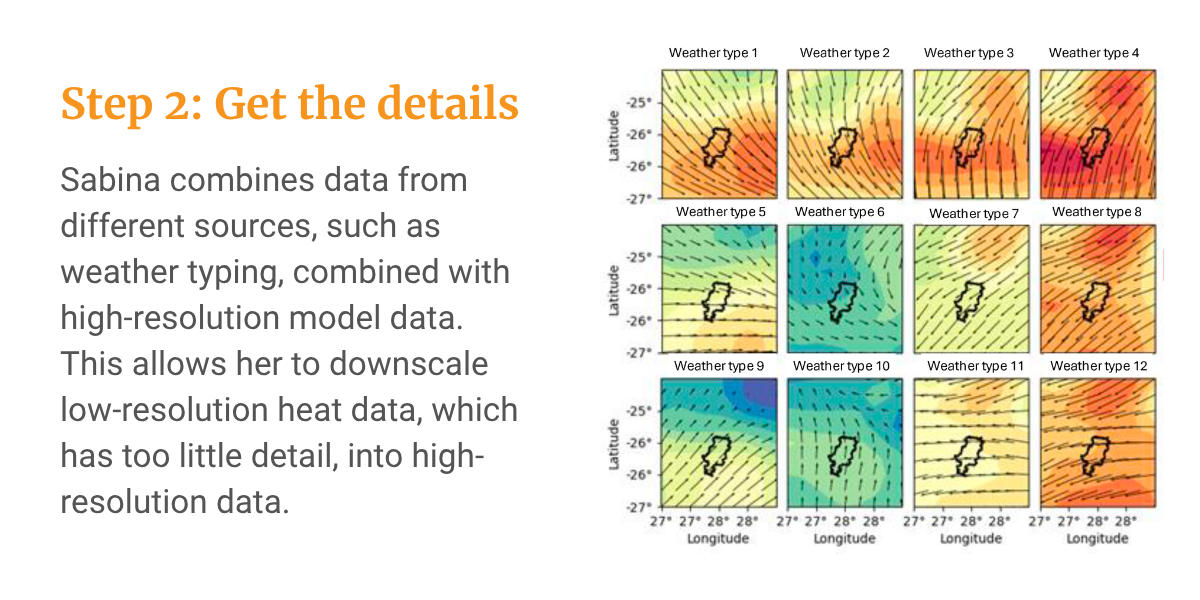
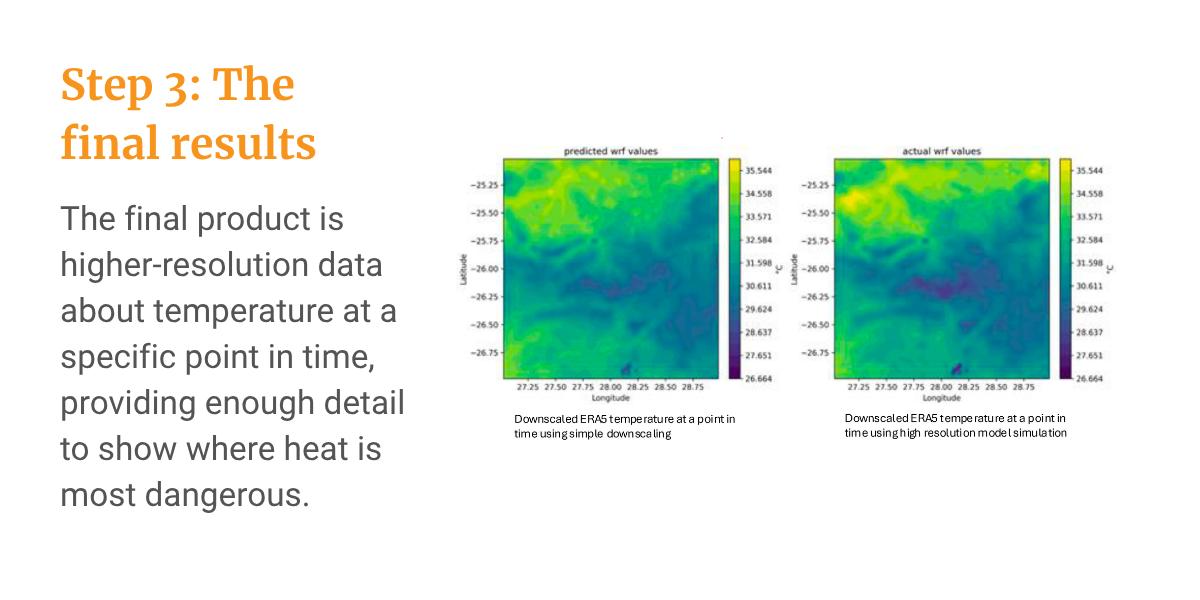
What I'm doing is making use of these models to understand the temperatures across an area like Johannesburg, South Africa at a higher resolution. This is computationally intensive work that requires expensive supercomputing and lots of time. I look for relationships between the existing reanalysis data, which has a lower resolution, and this new high-resolution data, to create a simpler model. This model would hopefully help us create more high-resolution data from the lower resolution data, without using too much computing power.
The crux is to try and find new ways of creating data that is useful, especially in the African context where we have data voids. I'm also assessing whether the method I'm using is truly useful and whether the computational effort is worthwhile.
From Modelling Data to Mapping Heat
My journey to asking these questions started several years ago. I was first exposed to climate modelling during my Honours studies in the Atmospheric Science programme at the University of Cape Town (UCT). It also helped that I did Maths as a major in my undergraduate degree, with some exposure to Computer Science. After that, it was a long road to complete my Masters and PhD degrees, and then training myself, both through trial and error and learning directly from experts who had experience working with these models and climate datasets.
When I started working in a permanent position at UCT, the HE²AT project had already started. It was a natural fit to work with Matthew Chersich, Principal Investigator for the HE²AT Center, and his research. Now I'm working on techniques for making it more efficient to create high-resolution climate data, given its complications, and to reduce the computational time required to do so. I'm also looking at whether we can use simpler statistical and machine learning techniques in the process.
We're still not sure if the method I want to use will reduce the computational resources required to create high-resolution data, but it will give me an understanding of when high-resolution data is an important requirement and when it isn't. This is especially important because not everyone has access to the computing power needed to create this kind of data. It's an opportunity to think carefully about when we need high-resolution climate data and when we don't – and ask whether it actually makes a difference.
“The advantage of working with the HE²AT Project was the thought process that it inspired.”
Working with the HE²AT team helped me to recognise the need for climate datasets for Africa, where we don't always have the resources to create high-resolution modelling. The HE²AT project inspired me to think about climate data and how detailed it needs to be. The scope of the project, with its reach across African cities, helped to show the need for data that is accurate and responsibly sourced, without the need for too many resources.
What Bad Climate Data Costs Us
I believe this work will create awareness that climate data is essentially messy and challenging, with lots of risk for malpractice, especially with transdisciplinary studies – which is not a criticism of these studies, but nevertheless a reality. People often bring in satellite data as is, which is not a good way of analysing heat information – for various reasons.
“There needs to be deep consideration about the kind of climate datasets that researchers use, because it could influence the results. It's important to explore what that influence is.”
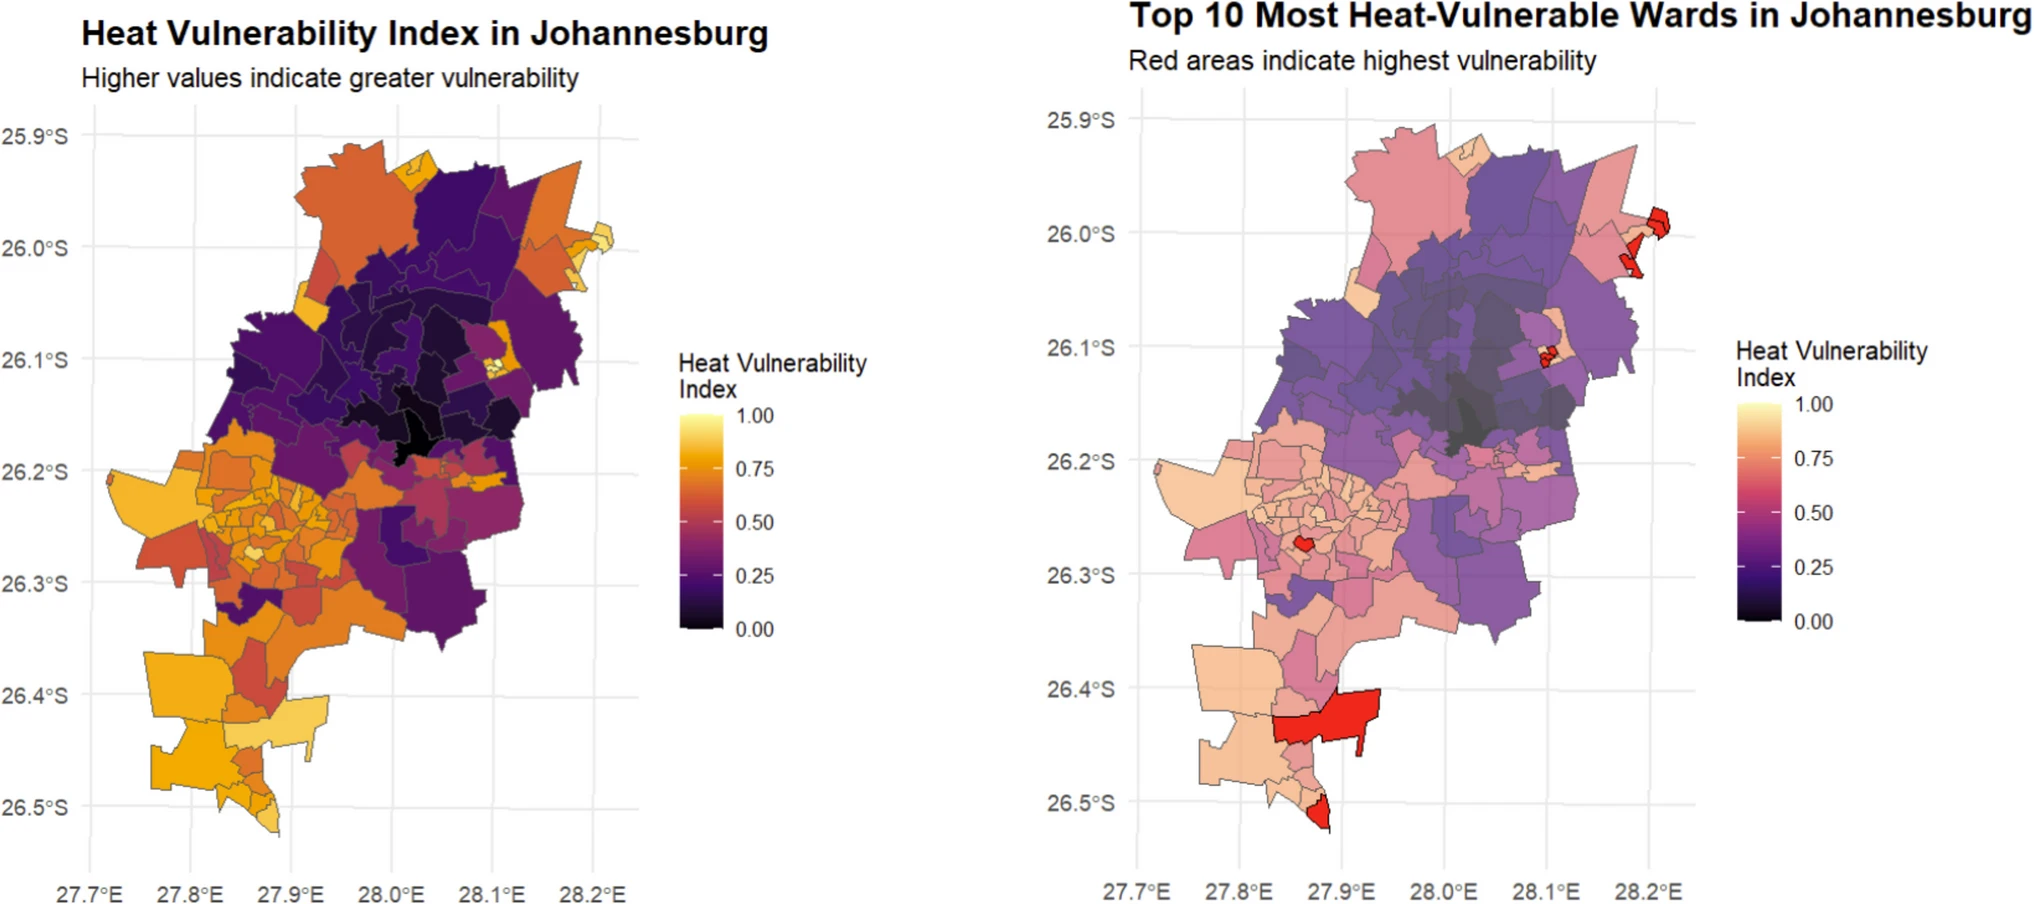
When you map out vulnerabilities, they can be influenced by the spatial relationship of your data. There can be a mismatch, which misrepresents where people are actually vulnerable.
It is especially important for researchers to have this awareness because they use tons of other data, and often the climate data seems like the simplest data to use. I want people to be aware that there are multiple ways to interpret this data.
Following the Data Wherever It Leads
Once I've created high-resolution heat data for specific African cities, I want to map out where really hot areas are. The aim would be to see how my different datasets (the high-resolution, the low-resolution and the simplified statistical datasets) differ in their indication of heat. This will allow us to understand the usefulness of different datasets and where these datasets break down. It should allow us to see how widely used datasets, like the global climate and weather dataset ECMWF Reanalysis v5 (ERA5), can be used but also how they shouldn't be used.
It's clear that modelling is always going to be a strong part of my research and I look forward to using it to help answer climate change questions. It's what I enjoyed most about the HE²AT project. It was an opportunity to learn about the social side of climate change and how heat affects communities on the ground.
I'm also considering several avenues for the future and prioritising my work based on where it can find most application. I'm working on projects that touch on malaria suitability, solar geoengineering in the Southern Hemisphere and global tipping points. My main interest is in doing impactful science, so I'm going in all directions to see where my work can be useful and where it finds application.